
Simulated Successful Clubs
Simulated Successful Clubs
Simulated Successful Clubs
Simulated Successful Clubs
Results from 2015 to 2023.
Results from 2015 to 2023.
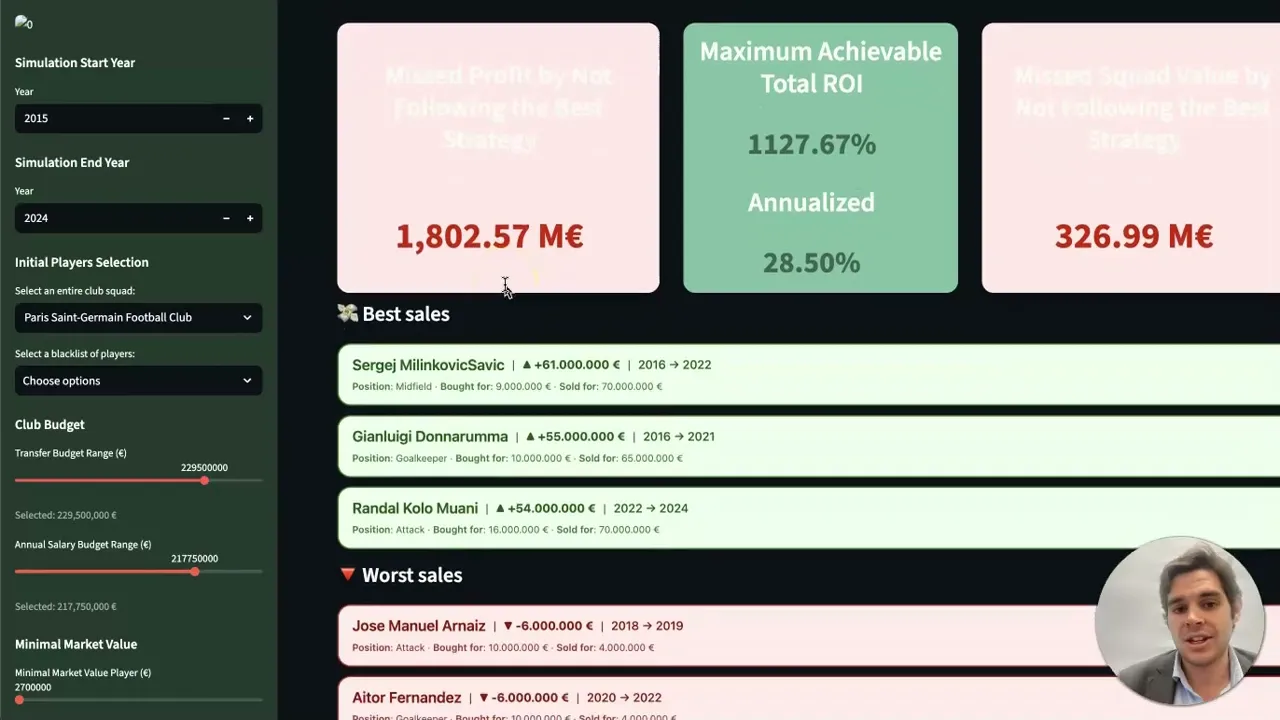
*Simulated results generated by the SoccerSolver optimisation model, applied retrospectively to the market decisions of major European clubs. The difference between SoccerSolver's net profit and actual net profit reflects the margin lost due to inefficient resource allocation. Even organisations with the highest budgets have structural inefficiencies: the problem is not the amount of capital available, but the scientific quality of the decision-making process.

+1.761M€*
+1.761M€*
+1.761M€*
SoccerSolver Net Profit
SoccerSolver Net Profit
SoccerSolver Net Profit
-995M€
-995M€
-995M€
Real Net Profit
Real Net Profit
Real Net Profit

+1.576M€*
+1.576M€*
+1.576M€*
SoccerSolver Net Profit
SoccerSolver Net Profit
SoccerSolver Net Profit
-1.304M€
-1.304M€
-1.304M€
Real Net Profit
Real Net Profit
Real Net Profit

+1.467M€*
+1.467M€*
+1.467M€*
SoccerSolver Net Profit
SoccerSolver Net Profit
SoccerSolver Net Profit
-1.093M€
-1.093M€
-1.093M€
Real Net Profit
Real Net Profit
Real Net Profit

+1.158M€*
+1.158M€*
+1.158M€*
SoccerSolver Net Profit
SoccerSolver Net Profit
SoccerSolver Net Profit
-913M€
-913M€
-913M€
Real Net Profit
Real Net Profit
Real Net Profit

+1.050M€*
+1.050M€*
+1.050M€*
SoccerSolver Net Profit
SoccerSolver Net Profit
SoccerSolver Net Profit
-552M€
-552M€
-552M€
Real Net Profit
Real Net Profit
Real Net Profit

+1.016M€*
+1.016M€*
+1.016M€*
SoccerSolver Net Profit
SoccerSolver Net Profit
SoccerSolver Net Profit
-816M€
-816M€
-816M€
Real Net Profit
Real Net Profit
Real Net Profit

+995M€*
+995M€*
+995M€*
SoccerSolver Net Profit
SoccerSolver Net Profit
SoccerSolver Net Profit
-591M€
-591M€
-591M€
Real Net Profit
Real Net Profit
Real Net Profit

+812M€*
+812M€*
+812M€*
SoccerSolver Net Profit
SoccerSolver Net Profit
SoccerSolver Net Profit
-424M€
-424M€
-424M€
Real Net Profit
Real Net Profit
Real Net Profit

+775M€*
+775M€*
+775M€*
SoccerSolver Net Profit
SoccerSolver Net Profit
SoccerSolver Net Profit
-562M€
-562M€
-562M€
Real Net Profit
Real Net Profit
Real Net Profit

+727M€*
+727M€*
+727M€*
SoccerSolver Net Profit
SoccerSolver Net Profit
SoccerSolver Net Profit
-273M€
-273M€
-273M€
Real Net Profit
Real Net Profit
Real Net Profit

+632M€*
+632M€*
+632M€*
SoccerSolver Net Profit
SoccerSolver Net Profit
SoccerSolver Net Profit
-321M€
-321M€
-321M€
Real Net Profit
Real Net Profit
Real Net Profit

+617M€*
+617M€*
+617M€*
SoccerSolver Net Profit
SoccerSolver Net Profit
SoccerSolver Net Profit
-450M€
-450M€
-450M€
Real Net Profit
Real Net Profit
Real Net Profit

+567M€*
+567M€*
+567M€*
SoccerSolver Net Profit
SoccerSolver Net Profit
-434M€
-434M€
-434M€
Real Net Profit
Real Net Profit

+551M€*
+551M€*
+551M€*
SoccerSolver Net Profit
SoccerSolver Net Profit
-231M€
-231M€
-231M€
Real Net Profit
Real Net Profit

+548M€*
+548M€*
+548M€*
SoccerSolver Net Profit
SoccerSolver Net Profit
-392M€
-392M€
-392M€
Real Net Profit
Real Net Profit

+508M€*
+508M€*
+508M€*
SoccerSolver Net Profit
SoccerSolver Net Profit
-381M€
-381M€
-381M€
Real Net Profit
Real Net Profit

+379M€*
+379M€*
+379M€*
SoccerSolver Net Profit
SoccerSolver Net Profit
-40M€
-40M€
-40M€
Real Net Profit
Real Net Profit

+374M€*
+374M€*
+374M€*
SoccerSolver Net Profit
SoccerSolver Net Profit
-264M€
-264M€
-264M€
Real Net Profit
Real Net Profit

+367M€*
+367M€*
+367M€*
SoccerSolver Net Profit
SoccerSolver Net Profit
-260M€
-260M€
-260M€
Real Net Profit
Real Net Profit

+365M€*
+365M€*
+365M€*
SoccerSolver Net Profit
SoccerSolver Net Profit
-104M€
-104M€
-104M€
Real Net Profit
Real Net Profit

+353M€*
+353M€*
+353M€*
SoccerSolver Net Profit
SoccerSolver Net Profit
-141M€
-141M€
-141M€
Real Net Profit
Real Net Profit

+331M€*
+331M€*
+331M€*
SoccerSolver Net Profit
SoccerSolver Net Profit
-160M€
-160M€
-160M€
Real Net Profit
Real Net Profit

+319M€*
+319M€*
+319M€*
SoccerSolver Net Profit
SoccerSolver Net Profit
-157M€
-157M€
-157M€
Real Net Profit
Real Net Profit

+310M€*
+310M€*
+310M€*
SoccerSolver Net Profit
SoccerSolver Net Profit
-200M€
-200M€
-200M€
Real Net Profit
Real Net Profit

+286M€*
+286M€*
+286M€*
SoccerSolver Net Profit
SoccerSolver Net Profit
-114M€
-114M€
-114M€
Real Net Profit
Real Net Profit

+270M€*
+270M€*
+270M€*
SoccerSolver Net Profit
SoccerSolver Net Profit
-62M€
-62M€
-62M€
Real Net Profit
Real Net Profit

+266M€*
+266M€*
+266M€*
SoccerSolver Net Profit
SoccerSolver Net Profit
-108M€
-108M€
-108M€
Real Net Profit
Real Net Profit

+252M€*
+252M€*
+252M€*
SoccerSolver Net Profit
SoccerSolver Net Profit
-131M€
-131M€
-131M€
Real Net Profit
Real Net Profit